 FalgunX
Bangladesh Net-Zero by 2050
Cost-optimal pathways under the NDC 3.0 ladder — a multi-sector PyPSA-Earth-Sec study
What we'll cover
- Bangladesh today — fleet, demand, emissions
- NDC 3.0 ladder & renewable potential
- PyPSA-Earth-Sec model & four scenarios
- 2050 system design — generation, storage, geography
- Costs, the EUR 10.5 Bn/yr net-zero premium
- Policy: CO₂ storage, industrial CC, market reform
Why Bangladesh, why now
A 170-million-person climate frontline state on a 7% growth trajectory, publishing its first net-zero anchor in NDC 3.0 (Sept 2025) — and the world's first coastal-LDC test of whether industrial decarbonisation can ride on carbon capture rather than fuel switching.
Sources: World Bank national accounts , NDC 3.0 inventory , IEA .
What the government has committed to
- 247 Mt CO₂ cap by 2030 (unconditional)
- 225 Mt CO₂ cap by 2035 (conditional on finance)
- Net-zero by 2050 — Bangladesh's first NZ anchor
- 30% EV share of new passenger cars by 2035 (conditional)
- Mujib Climate Prosperity Plan as enabling framework
We adopt these caps directly as the model's CO₂ budget.
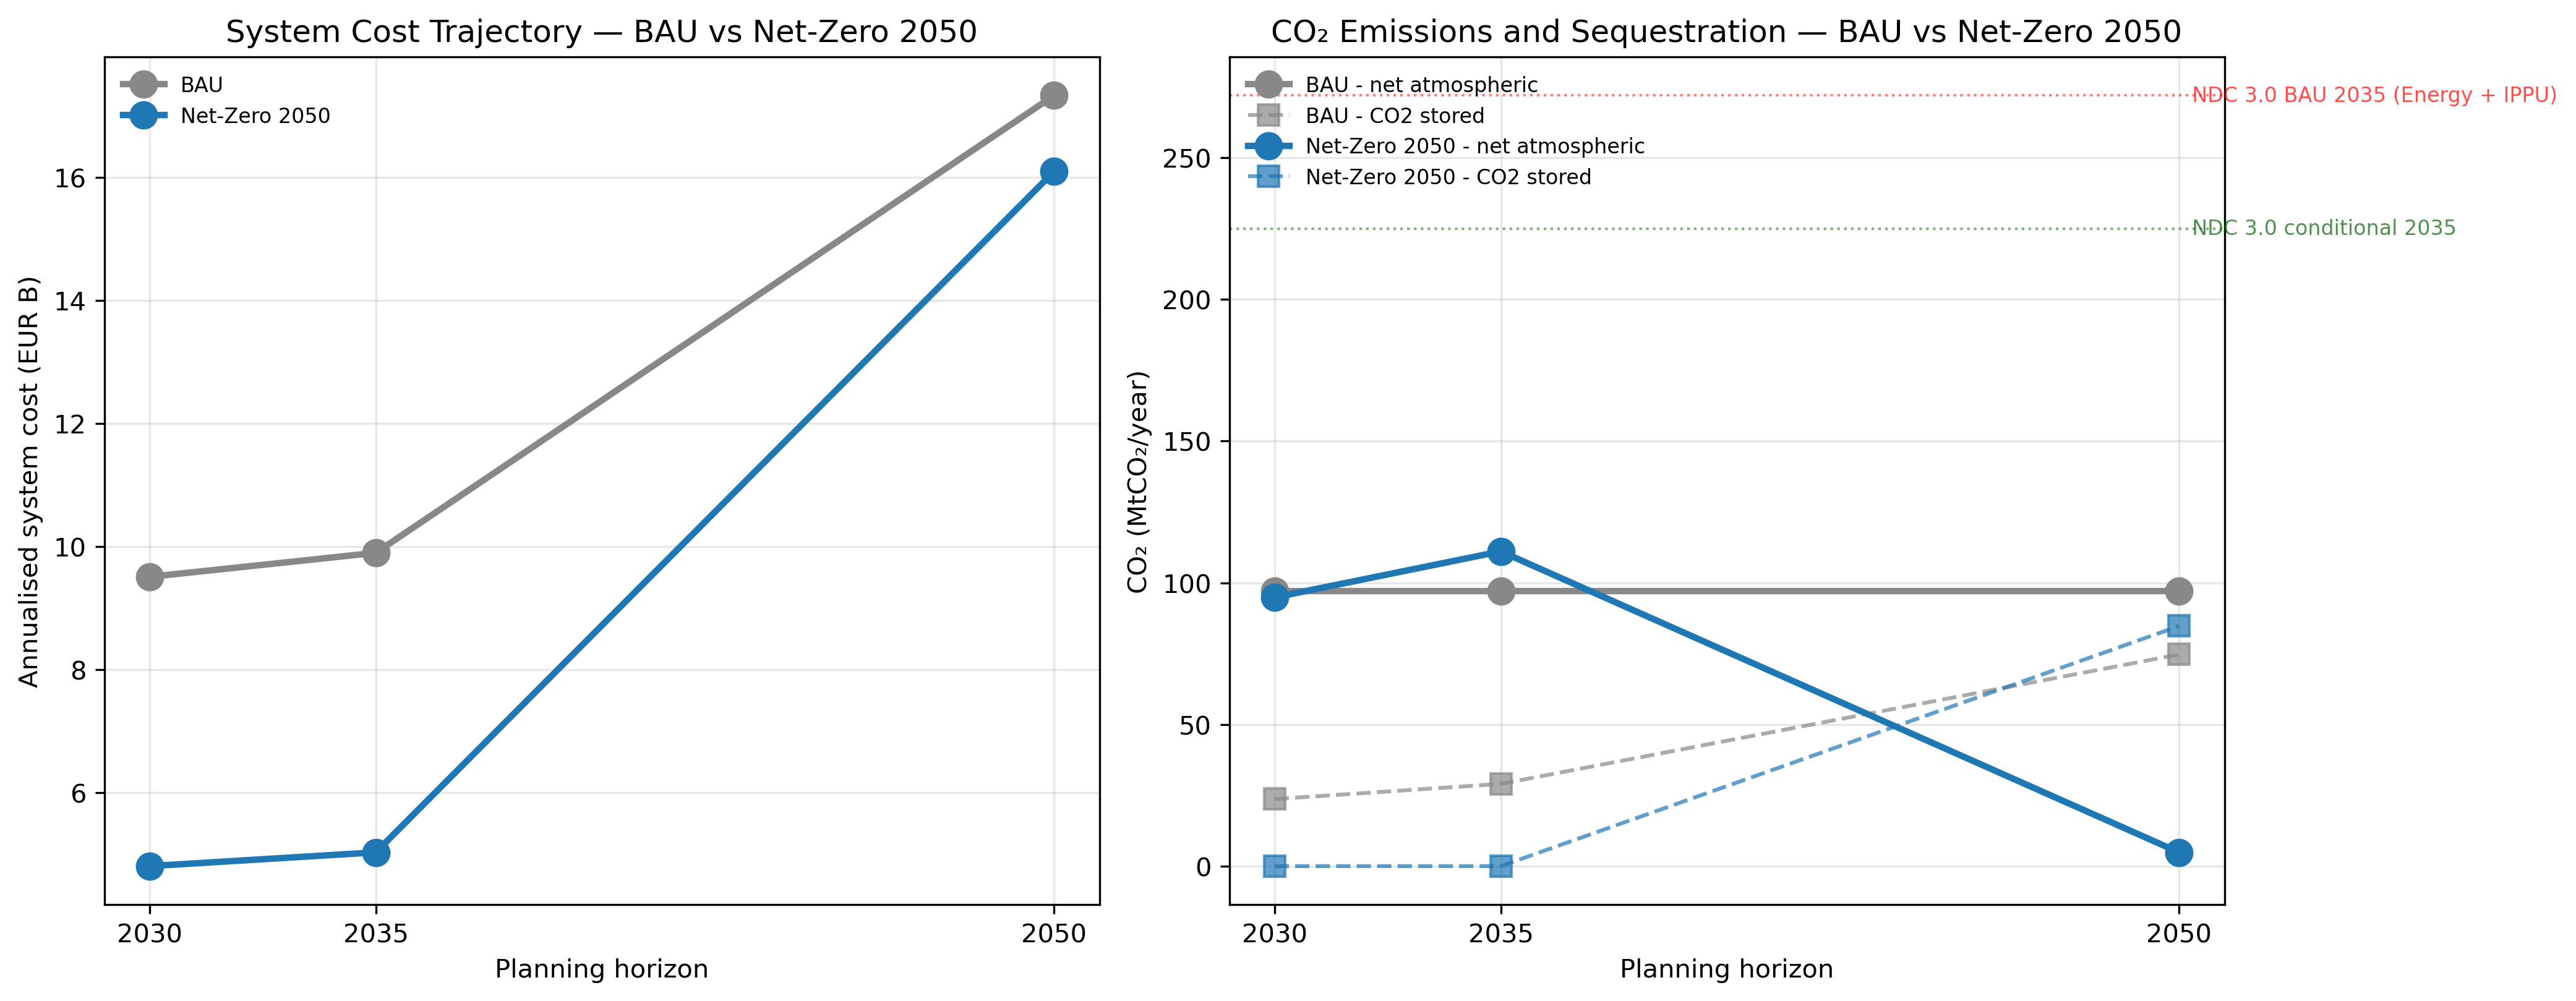
Source: NDC 3.0 inventory and pledges ; trajectories from Falgun PyPSA-Earth-Sec runs.
Today's electricity system
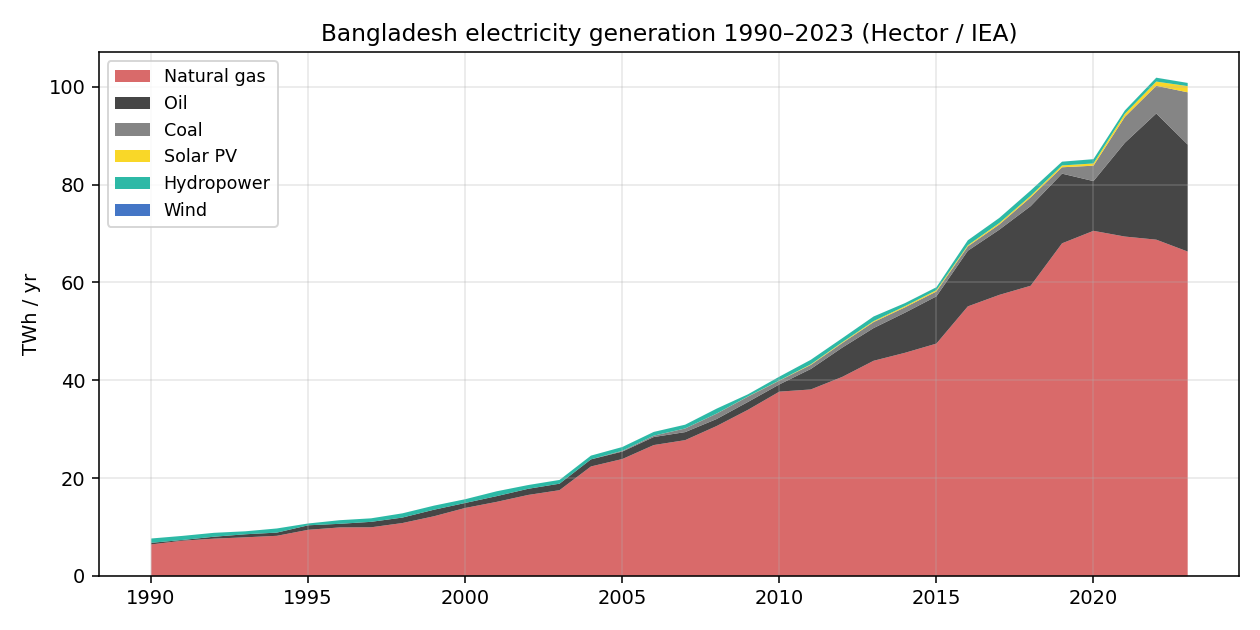
The starting fleet — 19.0 GW
- 10.9 GW gas (CCGT & OCGT) — 57%
- 6.1 GW oil — 32% (rental peakers)
- 1.7 GW coal — 9%
- 0.23 GW hydro · 0.06 GW solar
Brownfield seed for the model. PyPSA-Earth's global default mis-states the gas fleet by +37% — corrected against BPDB Annual Reports .
Sources: BPDB Annual Reports, PGCB grid data, IEA Bangladesh outlook .
Energy demand today, by sector
Industry alone consumes 112.5 TWh of final energy — almost half the modelled total and the binding constraint on every decarbonisation pathway. Transport, residential cooking, and a fast-growing services sector make up the remainder.
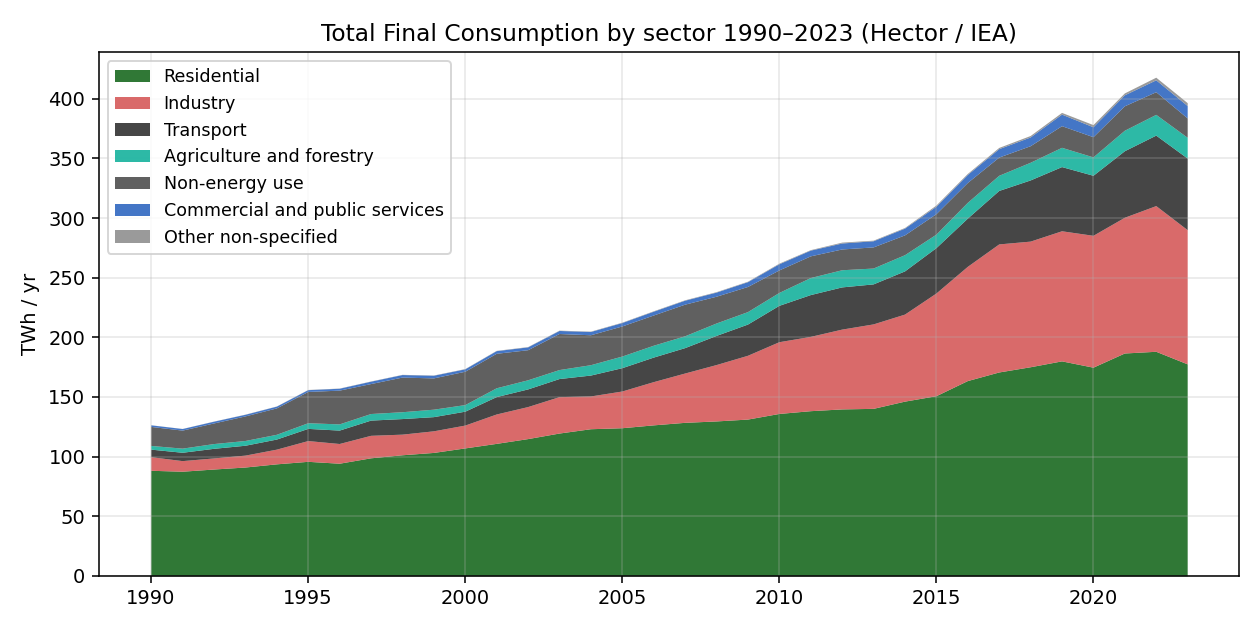
Sources: IEA Bangladesh 2023 actuals; growth rates from NDC 3.0 manufacturing CAGR .
Energy supply today — where the carbon comes from

Fossil fuels carry the system end-to-end. Industry runs on coal and gas (~80 TWh/yr combustion); transport on imported diesel and petrol; residential thermal is mostly biomass cooking, not space heating.
- Gas — primary fuel for power & industry; LNG-import dependent
- Coal — 1.7 GW operational; pipeline frozen ("no new builds" since IEPMP 2023)
- Oil — rental peakers and the entire road-transport energy bill
- Biomass — ~95 TWh residential cooking in chulha stoves at 10–15% efficiency
- Solar & wind — <1% of supply at the 2019 baseline
Sources: IEA 2023 energy balance, BPDB & Petrobangla, fuel-share calibration via WHO/ESMAP cooking surveys.
Economy: where the load goes
The model covers ~80–85% of GDP and ~63–65% of GHG: power, industry, buildings, road transport. Agriculture (CH₄/N₂O) and shipping/rail (< 0.4% combined energy) sit outside scope.
Industry · modelled
Cement (35%), RMG textiles (25%), food (12%), iron & steel (8%), chemicals (8%). The decarbonisation pivot point.
Services · modelled
Trade, finance, telecoms, real estate. Cooling demand surging — driver of post-2035 electricity growth.
Agriculture · excluded
Rice paddy CH₄ & fertiliser N₂O dominate. Non-energy emissions outside model boundary; diesel pumps captured in industry.
Transport, residential, other · modelled
Road transport (88% of passengers), residential cooking, brick kilns. Treated explicitly via sector-coupled buses.
Sources: BBS national accounts; BUR1 sectoral inventory; NDC 3.0 sector boundaries .
Where emissions sit today
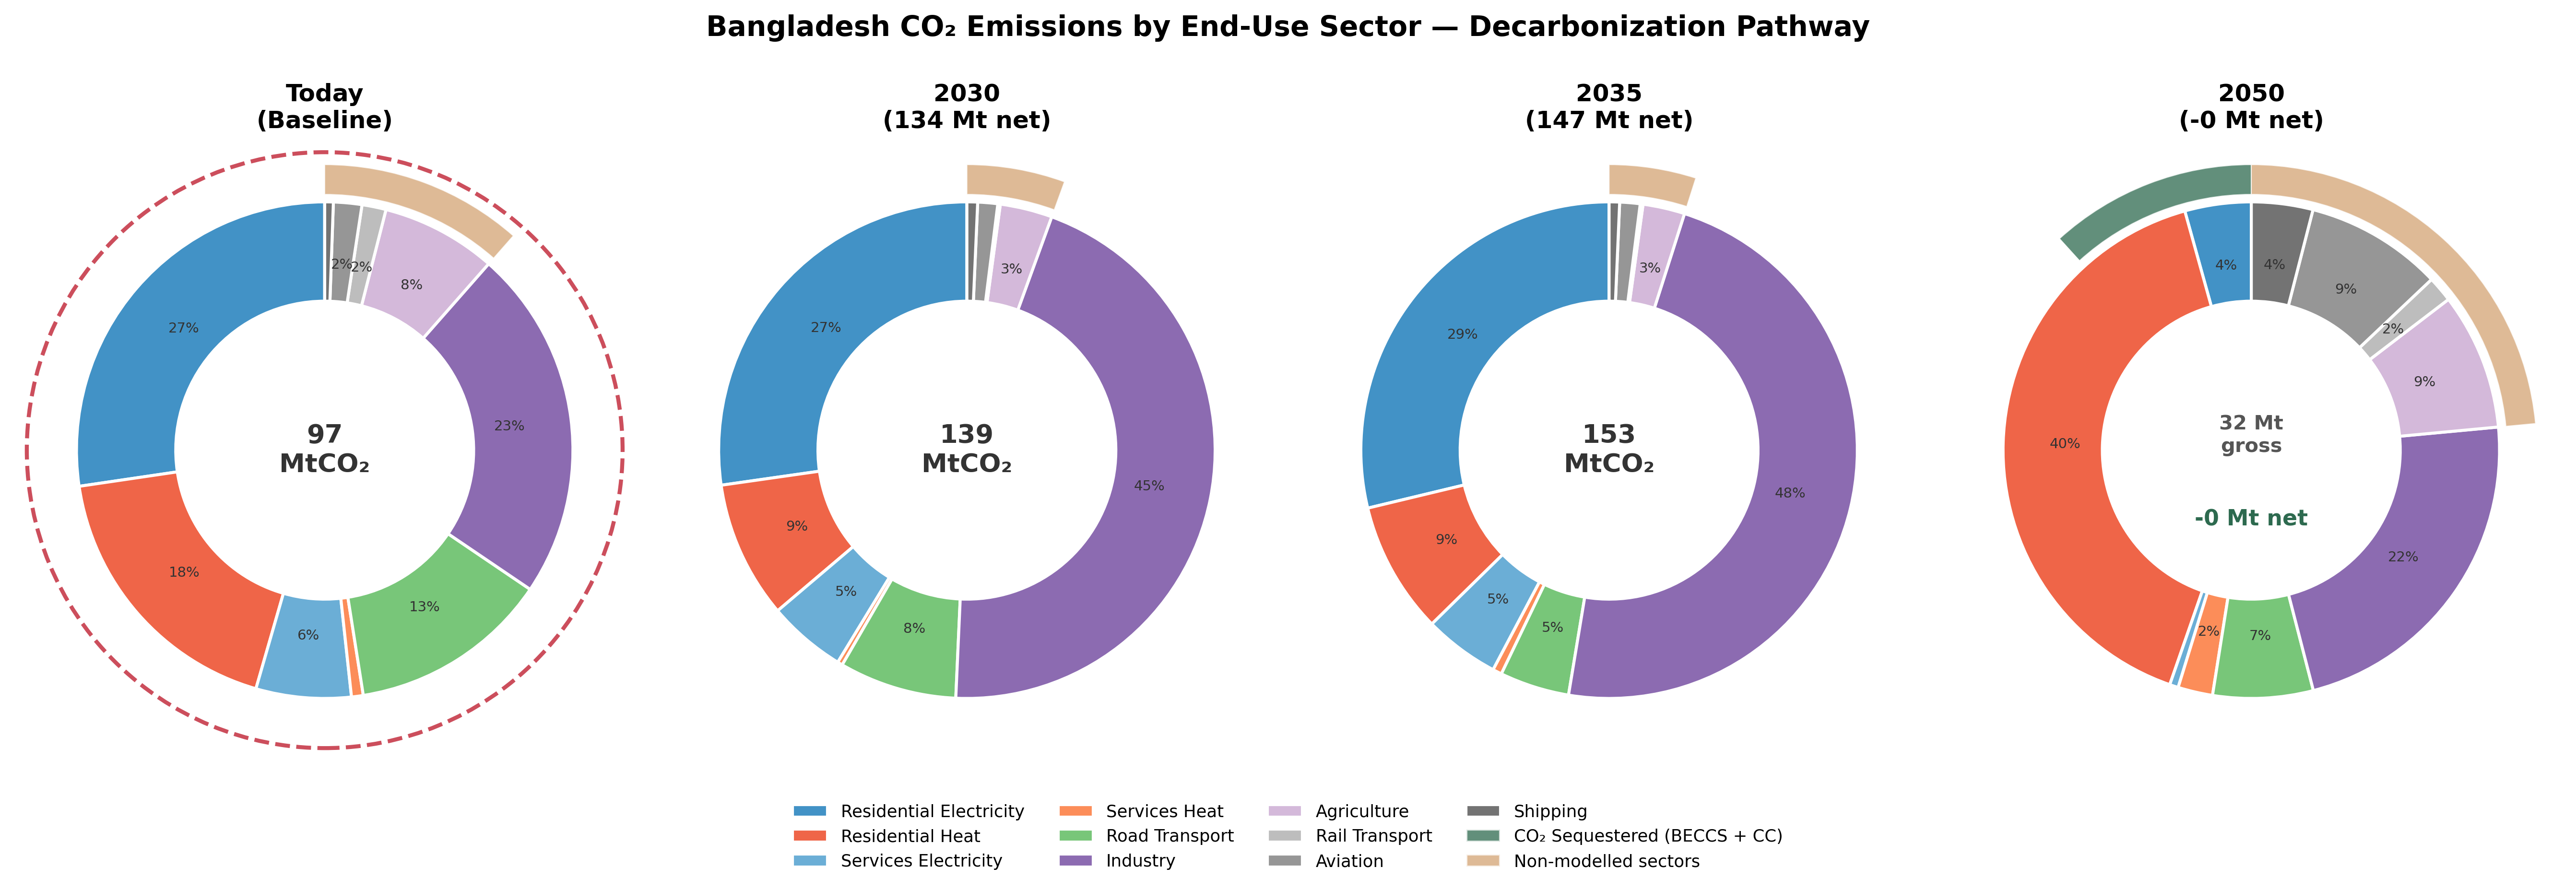
Of ~130 Mt CO₂eq energy + IPPU emissions in 2022, two sectors carry the load: electricity (23%) and industry (25%). Cement clinker calcination alone — pure process chemistry, no fuel — adds 26 Mt CO₂/yr in 2030, climbing to 47 Mt by 2050.
The remaining ~45% is split between buildings (~9%) and excluded sectors — agriculture (CH₄/N₂O), shipping, rail. Energy + IPPU is where policy can move the dial.
Sources: BUR1 (2023) inventory; NDC 3.0 sectoral table; cement process emissions from IEA cement model. Boundary: energy + IPPU CO₂ only.
Renewable resource — what ERA5 actually shows
Bangladesh has plenty of solar resource and a long Bay-of-Bengal offshore window. Onshore wind is poor outside Barishal. Capacity factors below are computed on ERA5-2013 across all 8 nodes.
CF 13.6%
Effectively unlimited (no binding p_nom_max). Range 13.1% Chittagong → 13.9% Rajshahi. Seasonality: 16–18% Nov–Mar dry, 10–11% May–Sep monsoon.
CF 25.2%
Potential 177–531 GW in Bay of Bengal. Rarely picked by the optimiser today — CCGT + nuclear cheaper at our cost assumptions. Cyclone-resilient design unproven.
CF 8.1%
108 GW technical potential but not selected in BAU and barely (2.2 GW) in NZ. Range 3.3% Chittagong → 14.4% Barishal. Economics dominated by solar + storage.
Source: ERA5-2013 atlite cutout, GADM-1 division clusters; capacity-factor methodology per PyPSA-Earth .
The market that has to deliver this — single-buyer BPDB
Bangladesh sits at stage 2–3 on the five-stage liberalisation staircase . One state utility, BPDB, wears three hats:
- Generator (own fleet)
- Single buyer (counterparty to every IPP/SPP PPA)
- Distributor (multiple DISCOs)
PGCB carved out for transmission (2003); BERC's pricing authority was bypassed by the government for years and only partially restored by Aug 2024 gazette.
SOAS-ACE (2024) documents the consequence: under the Quick Enhancement of Electricity Act, politically connected firms secured PPAs without competitive bidding.
3.87×
Solar LCoE in Bangladesh vs India.
1.47× vs Vietnam.
Source: SOAS Anti-Corruption Evidence programme .
Why this slide matters: stage-2 market design is structurally incompatible with flexibility markets, time-of-use pricing, and V2G — the smart-system instruments needed by 2050. We come back to this in Part 5.
Modelling approach: PyPSA-Earth-Sec, sector-coupled
-
Open-source & reproducible
PyPSA-Earth v0.8.0 with sector-coupling extensions; all configs & patches in the public team repo.
-
Sector-coupled, endogenous substitution
Power · industry · road transport · residential heat & cooking · services · biomass · hydrogen all co-optimised. Five industrial pathways per demand bus (direct, +CC, gas-switch, gas+CC, electric).
-
Three horizons, 3-hour resolution
2030 / 2035 / 2050 myopic + greenfield 2050 cross-checks. 8 nodes (administrative divisions, k-means clustered), 2920 snapshots/yr, 7.1% discount rate, Gurobi 12 with crossover off.
-
NDC-anchored CO₂ caps + brownfield seed
CO₂ budgets calibrated to NDC 3.0 unconditional / conditional. BPDB-validated 2019 fleet preserved as extendable brownfield (can retire, can't regrow).
Underlying framework: . Three patches applied: existing-fleet de-duplication, CCGT/OCGT vintaging, brownfield retirement re-enabled.
Scenario design: 2 stringencies × 2 foresight modes
| Case | Foresight | 2030 cap | 2035 cap | 2050 cap | Story |
|---|---|---|---|---|---|
| BAU NDC | Myopic, 3 horizons | 247 Mt | 262 Mt | 970 Mt (unbounded) | NDC 3.0 unconditional; oil extendable |
| Net-Zero NDC | Myopic, 3 horizons | 247 Mt | 225 Mt | 0 Mt | NDC 3.0 conditional; true net-zero |
| BAU Greenfield 2050 | Overnight, 2050 only | — | — | 970 Mt | Cost-optimal endpoint, no path-dependence |
| NZ Greenfield 2050 | Overnight, 2050 only | — | — | 0 Mt | Cost-optimal endpoint at zero |
Two findings worth flagging up front: (i) the myopic–greenfield pair brackets the foresight tax — the cost of not anticipating future cap stringency. We find it small (+5.5%, EUR 2.2 Bn/yr), but it shifts the mix sharply: greenfield NZ goes harder on nuclear, lighter on solar. (ii) The NDC 3.0 conditional 2035 cap (225 Mt) is non-binding under cost-optimal deployment — modelled emissions are 148 Mt at 2035 in both scenarios. There is headroom to ratchet the 2035 ambition further if finance is forthcoming.
CO₂ caps anchored to NDC 3.0 inventory and pledges .
Demand grows; intensity falls
Anchored to NDC 3.0 manufacturing CAGR (~12%/yr to 2030), tapering to 2%/yr by 2050. Sectoral split held at 2023 IEA shares: cement & non-metallic minerals 35%, RMG textiles 25%, food 12%, iron & steel 8%, chemicals 8%.
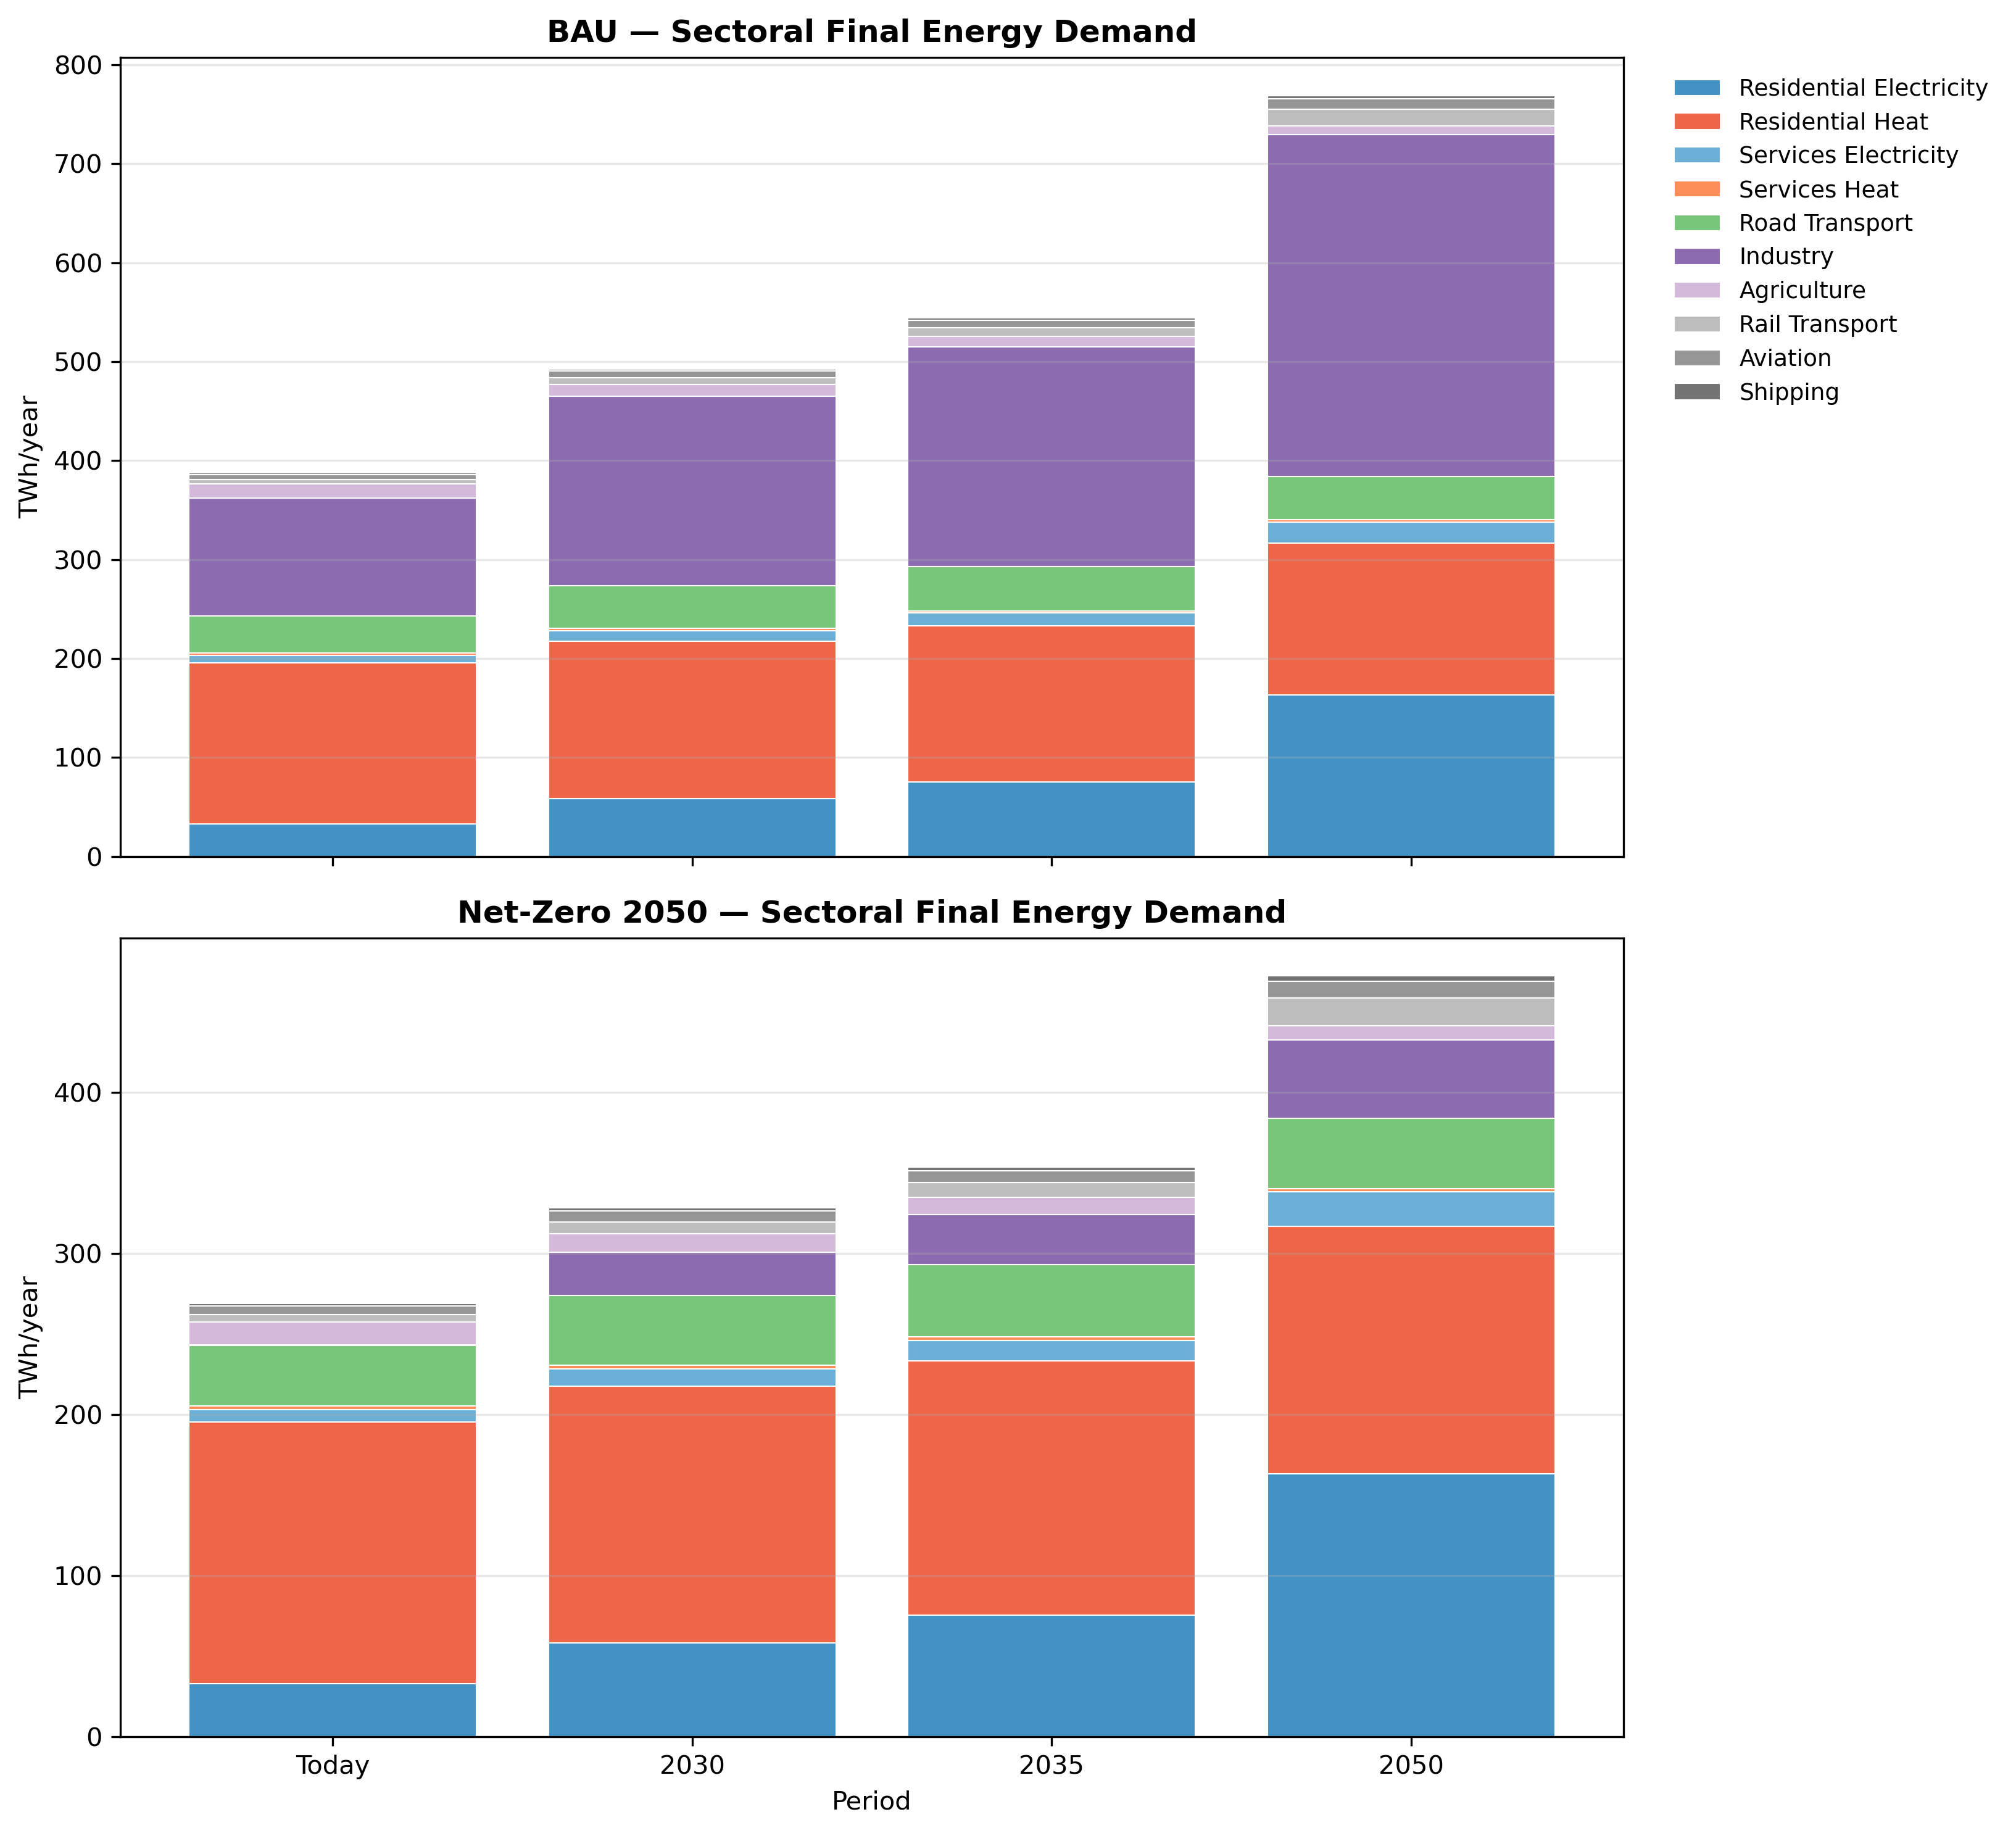
Demand calibration: IEA 2023 actuals + NDC 3.0 growth rates ; corrects coal-heavy IEPMP "PP2041" overestimate flagged by CPD.
Load profile — and why it favours solar
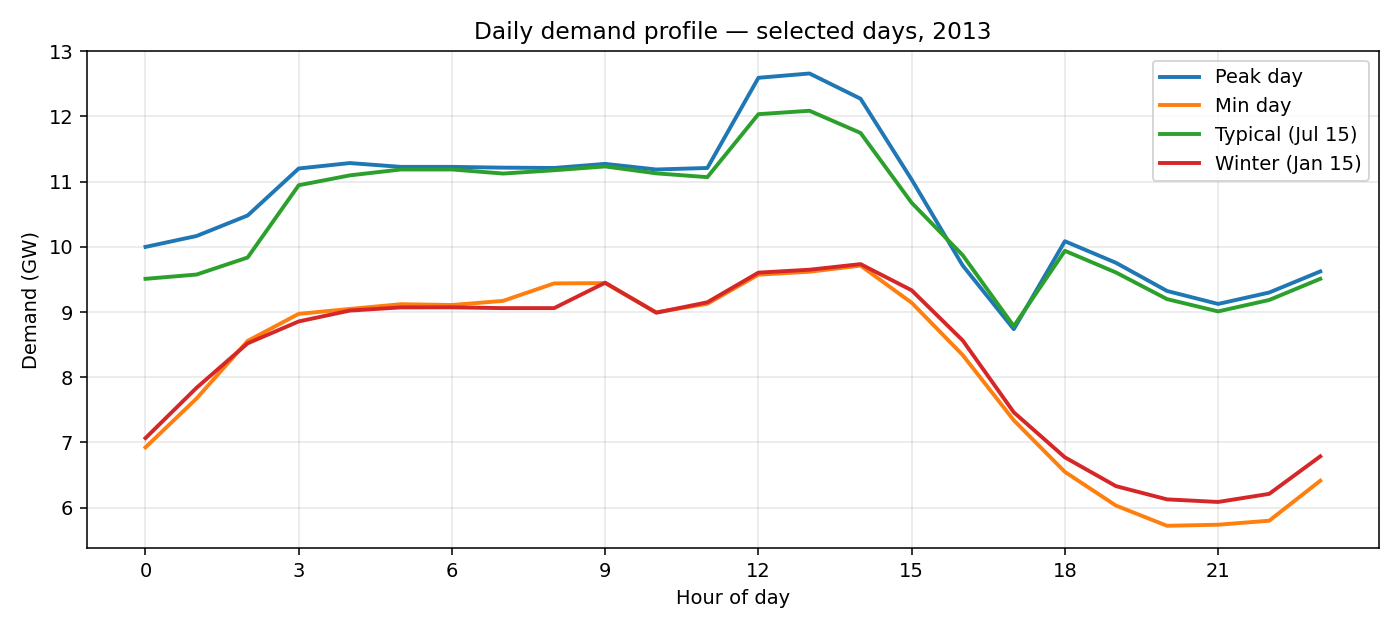
Coincidence factor 0.85
Mid-day demand peak (cooling + irrigation + industry) lines up with solar PV's noon output — 0.85 vs ~0.40 for typical European systems. A finance-ask we can quantify.
Diurnal trough 7 GW at 04:00–06:00; mid-day plateau 10–11 GW; April–September runs ~30% above November–February (cooling + Boro paddy irrigation, ~20% of grain output).
Source: 2013 ERA5 weather year applied to BPDB-validated demand. Caveat — Phase-2 hourly cross-check shows 3-h resolution under-states storage needs once solar >30 GW; headline 2050 storage figures are a lower bound.
2050 capacity mix — solar pivots to nuclear under the cap
| Technology | BAU 2050 | NZ 2050 | Δ NZ vs BAU | Read |
|---|---|---|---|---|
| Solar PV | 140.3 GW | 107.9 GW | −32.4 GW | Solar still huge, but ceiling lower under NZ |
| Nuclear | 4.1 GW | 25.2 GW | +21.1 GW | ~6 additional Rooppur-sized units |
| Onshore wind | 0.0 GW | 2.2 GW | +2.2 GW | Picked only when CO₂ binds |
| CCGT (gas) | 18.2 GWth | 3.5 GWth | −14.7 GWth | Residual peakers only under NZ |
| Coal | 7.1 GWth | 0 GW | −7.1 GWth | Existing fleet retires entirely |
| Battery storage | 230 GWh | 171 GWh | −59 GWh | Less storage when nuclear dispatches firm |
| Industrial CC + DAC | 0 GW | 16.3 GW | +16.3 GW | 7.8 coal CC · 5.4 process · 3.15 DAC |
Two surprises: nuclear scales 6× off the Rooppur base, and the BAU coal fleet survives — only NZ retires it. Hydrogen is zero across all cases (3-hour resolution dampens the ramp-rate signal that triggers H₂).
Source: Table 12 in the model notes; values from solved postnetworks.
Where the 2050 capacity actually lands
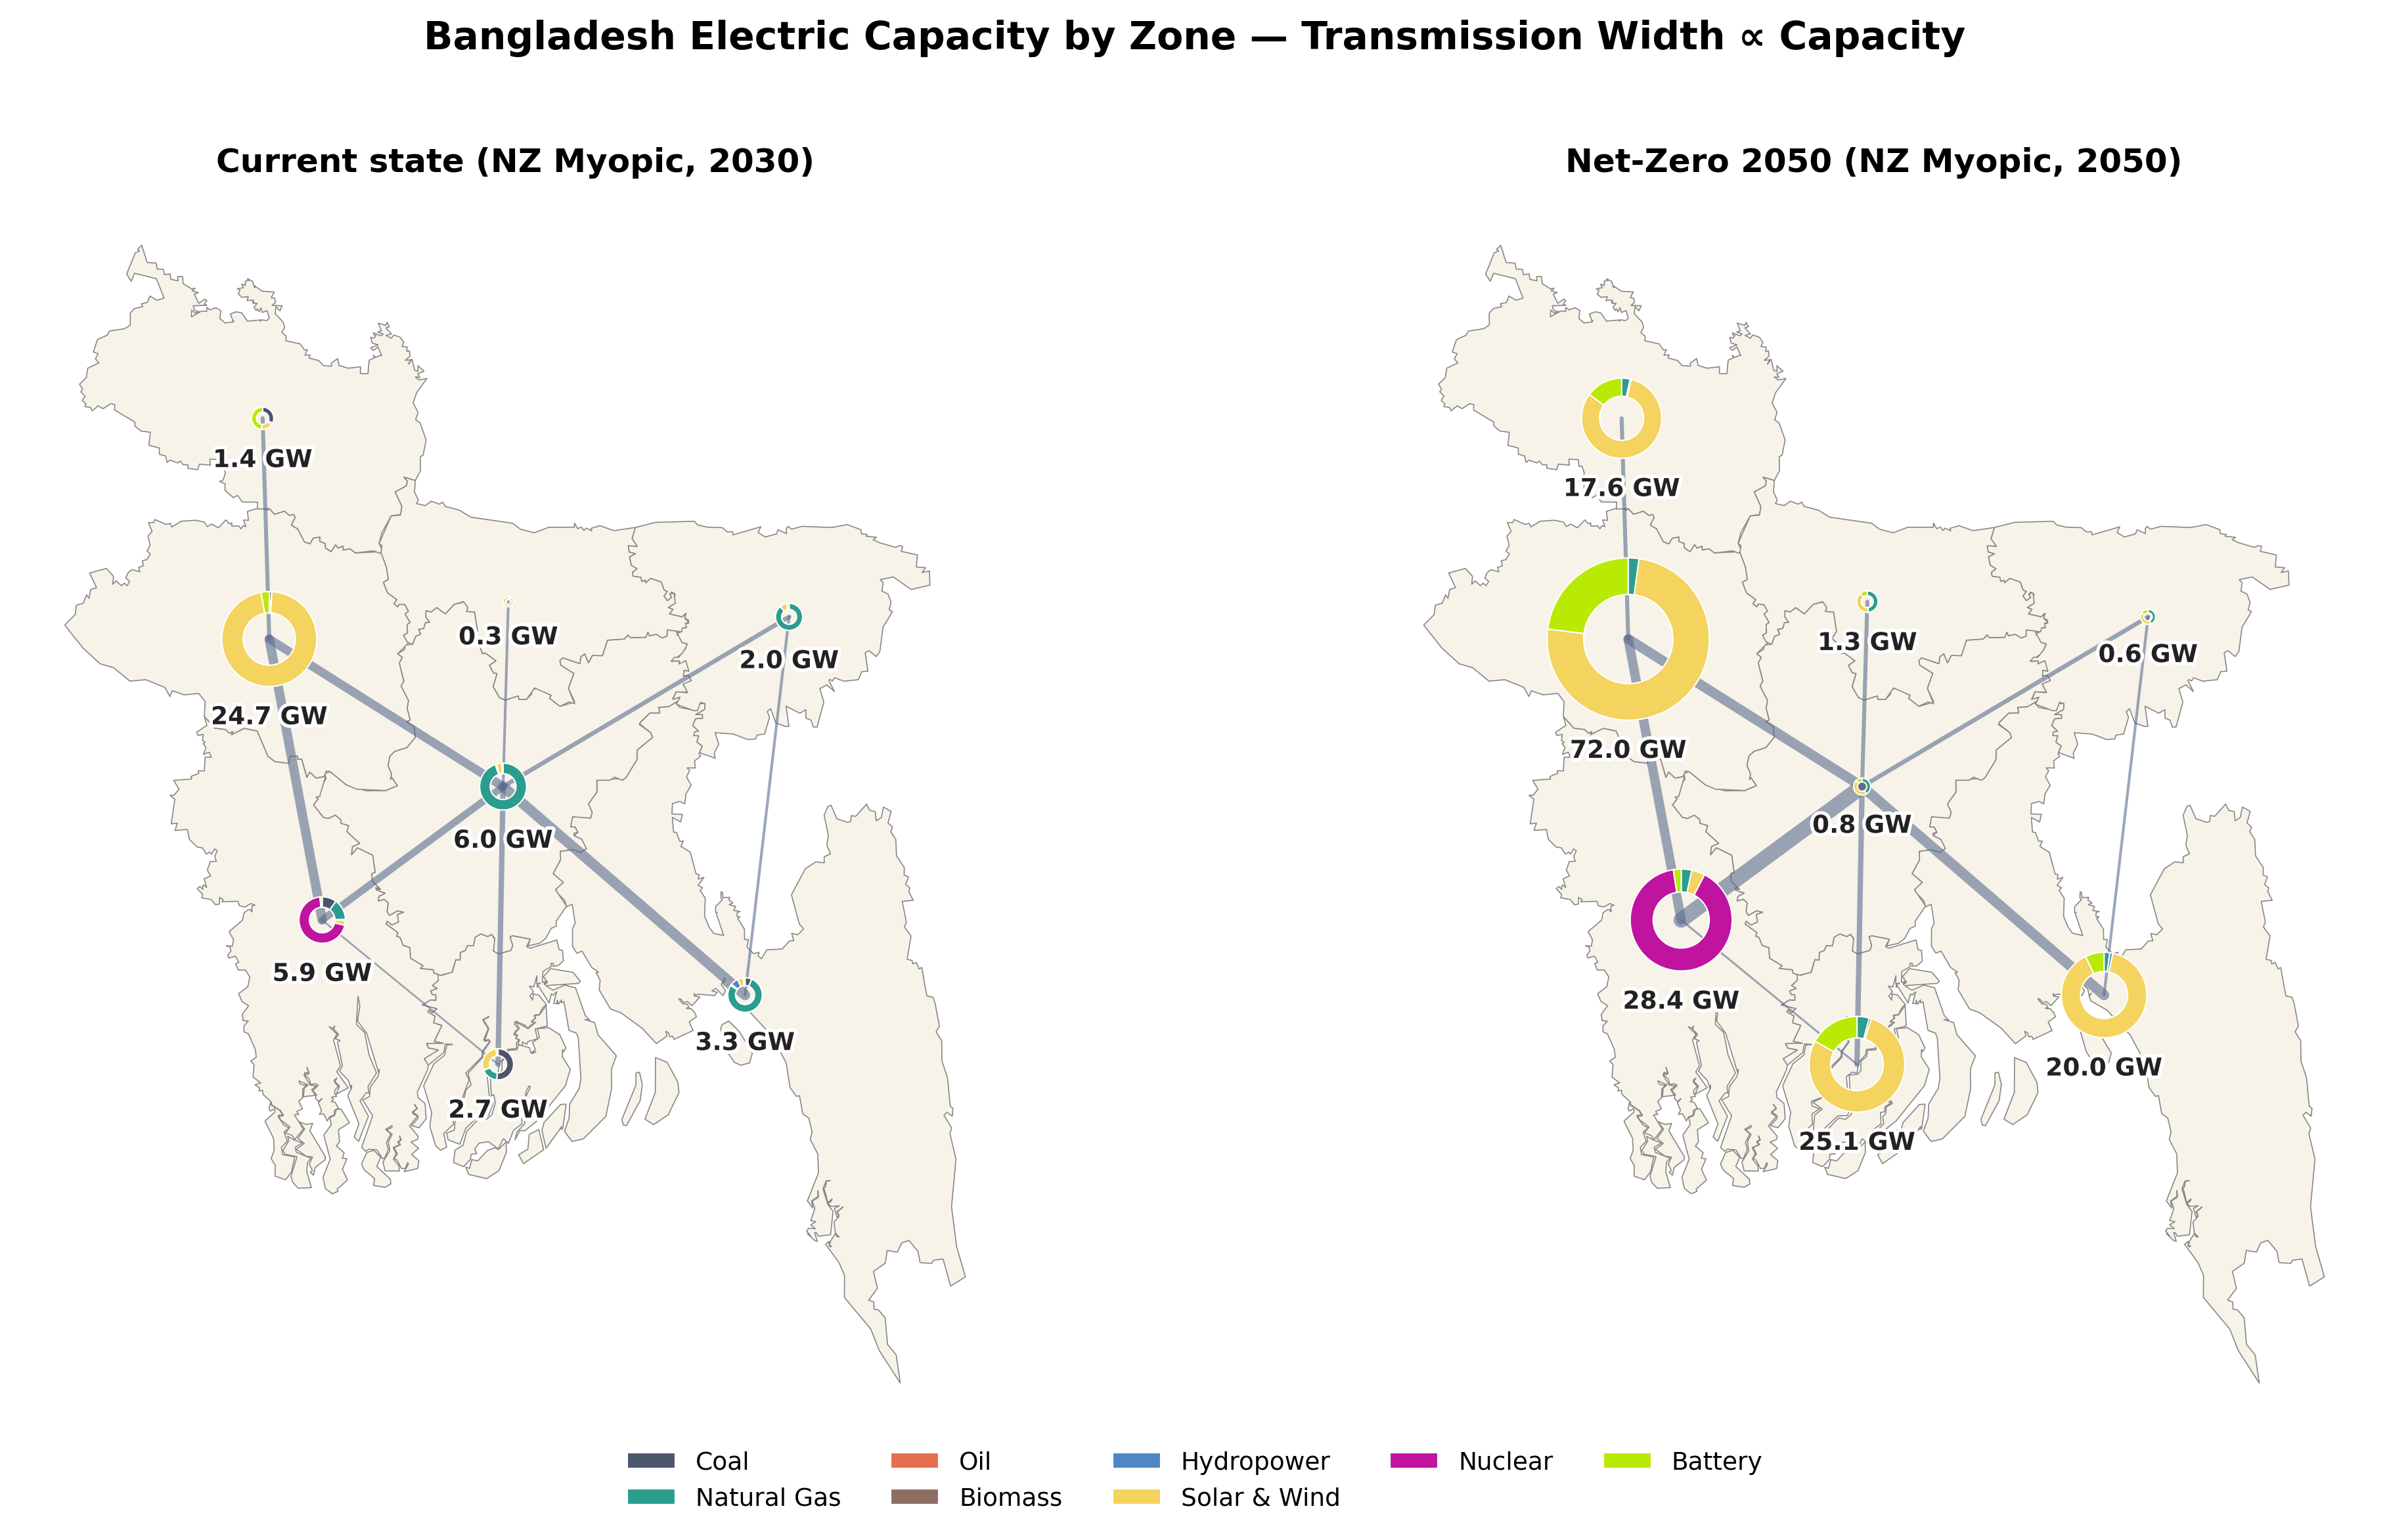
- Dhaka — 72.0 GW · solar + nuclear hub
- Chattogram — 28.4 GW · nuclear + offshore option
- Rajshahi — 25.1 GW · utility solar belt
- Khulna — 20.0 GW · solar + battery
- Barishal — 17.6 GW · solar + onshore wind
- Rangpur, Sylhet, Mymensingh — 1–2 GW each
Solar dominates everywhere; nuclear concentrates in Dhaka and Chattogram clusters.
Caveat: 8-node clustering hides intra-zonal congestion — finer (30+ node) modelling needed for distribution-level planning.
Transmission — one corridor carries the entire net-zero programme
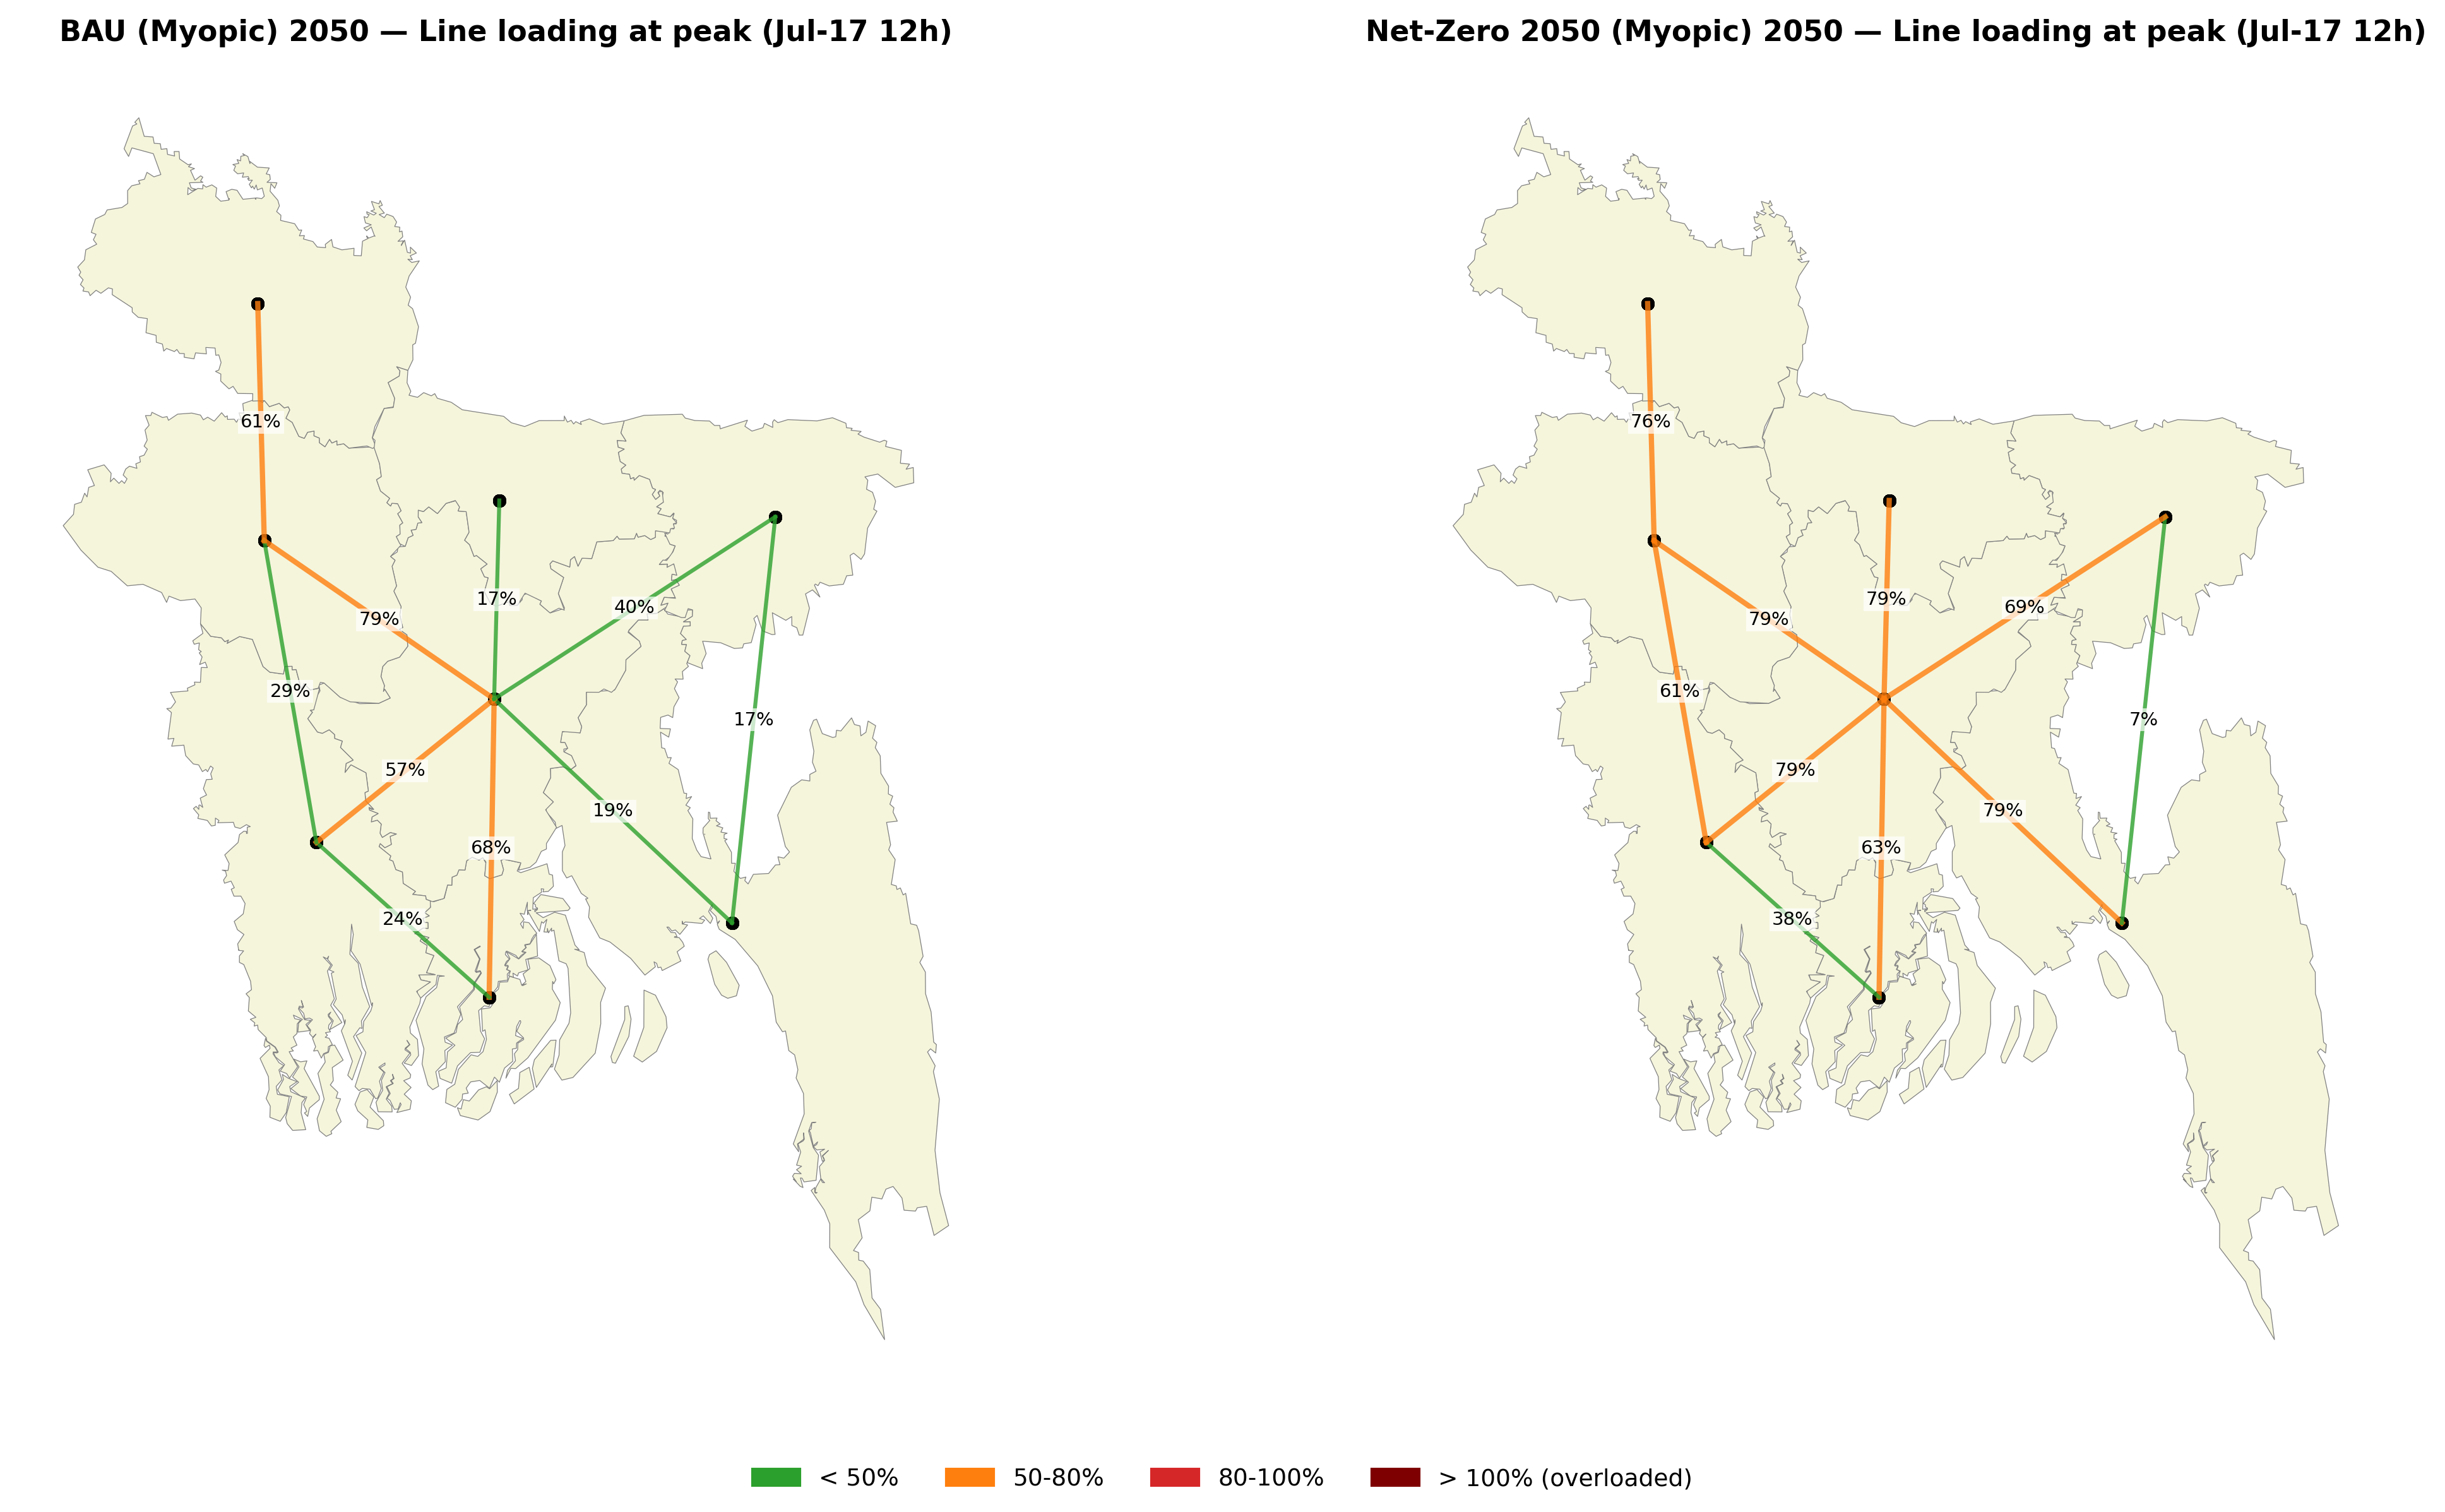
73% on one corridor
Dhaka ↔ Khulna alone absorbs 10,507 MW of national expansion under NZ. Plus Dhaka ↔ Sylhet (+2.0 GW) and Dhaka ↔ Mymensingh (+1.5 GW).
Decision by 2030
PGCB's 380 kV projects take 5–7 years approval-to-commissioning . For a 2050-feasible NZ pathway, the Dhaka–Khulna planning decision must be taken by 2030 — a binding policy constraint not captured in the EUR 10.5 Bn cost number.
Six of ten corridors hit ≥79% peak loading under NZ — tight design point with limited N-1 headroom; either +5–10% capex or co-located storage at Khulna needed to meet PGCB grid code.
The price tag of net-zero
Going from BAU to net-zero at 2050 costs an extra EUR 10.5 Bn/yr (+36%) — almost entirely investment. CAPEX nearly doubles; fuel costs barely move because the system burns roughly the same hydrocarbons either way, just routed through carbon capture.
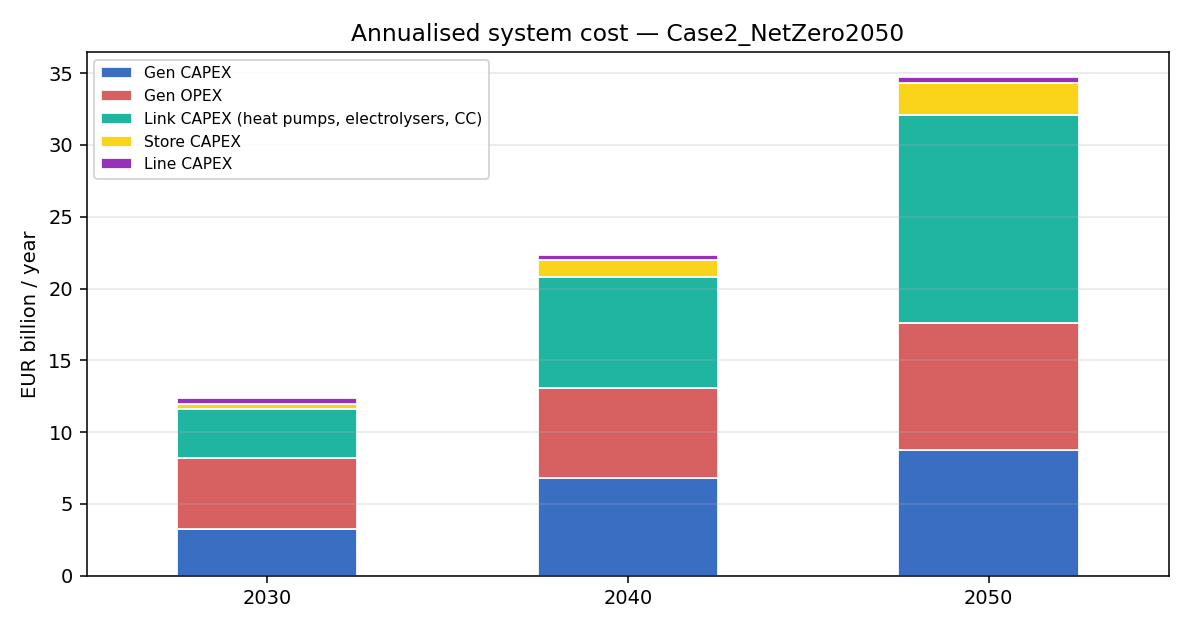
Where the cost goes — industrial CC, not power
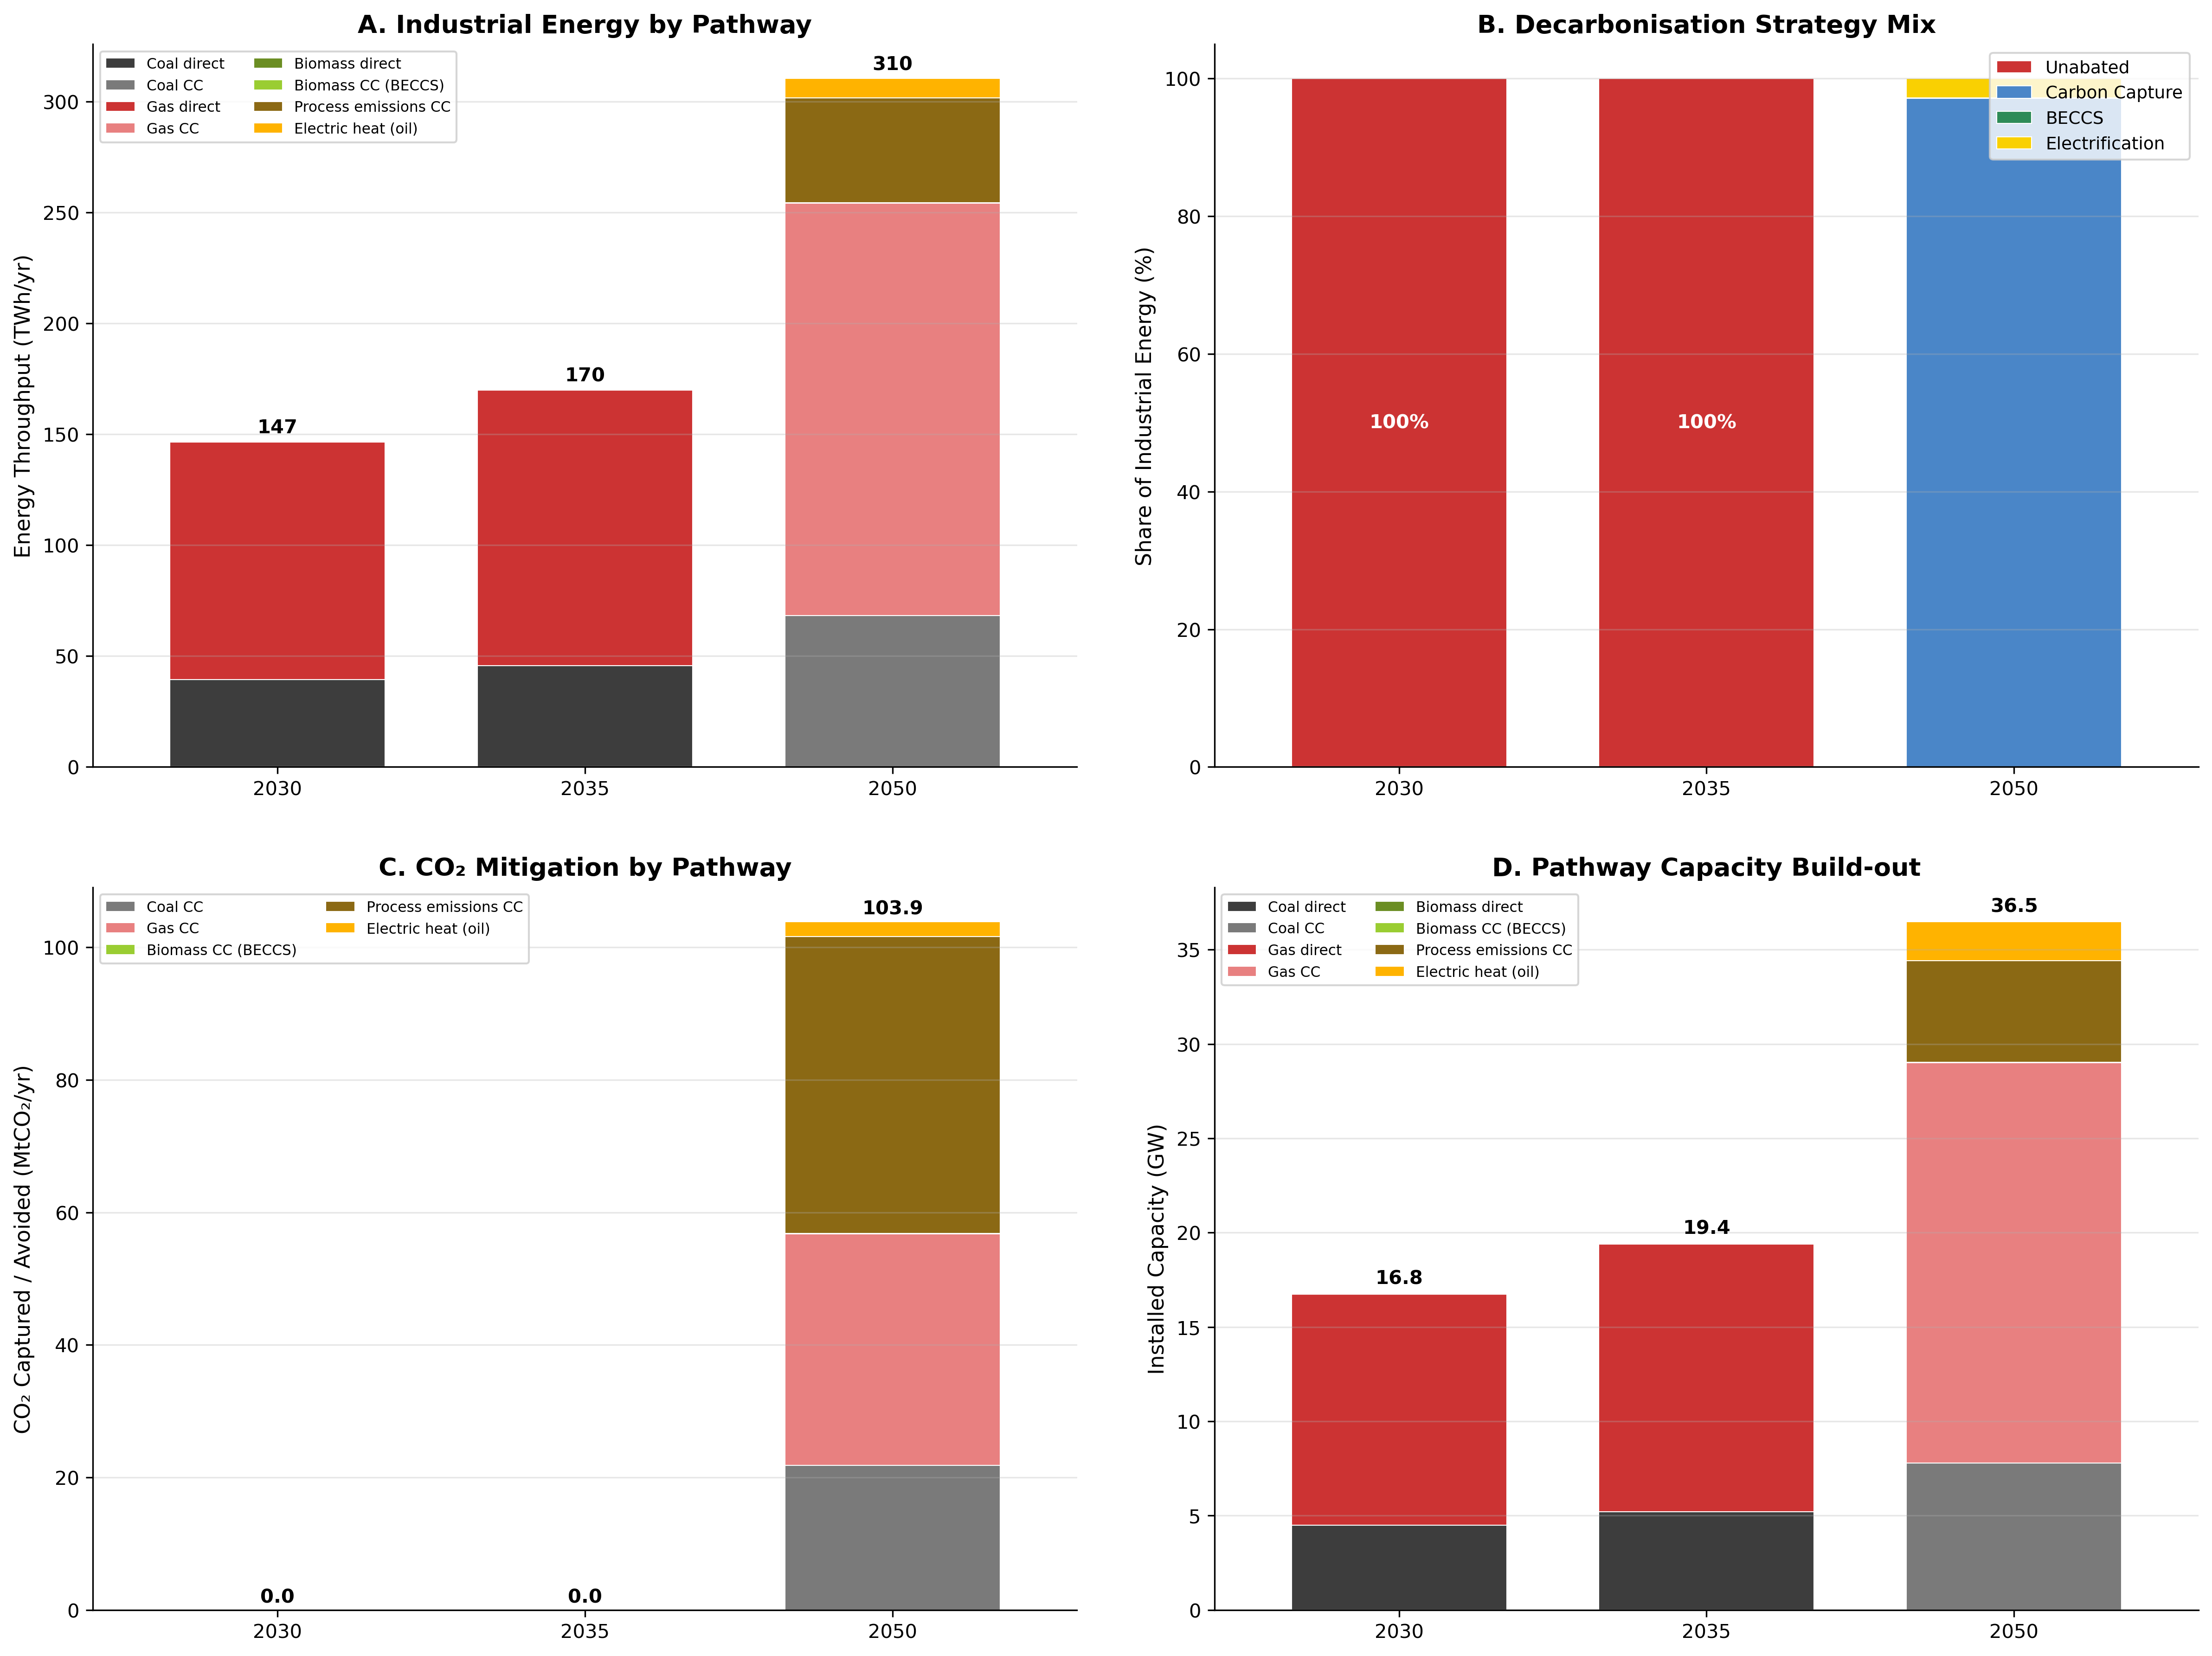
Industry is the binding constraint: 104.2 Mt CO₂/yr in BAU 2050, 57% of modelled total. Net-Zero collapses it to 7.2 Mt via:
- 7.8 GW coal industry CC
- 5.4 GW process emissions CC (cement clinker)
- 3.15 GW Direct Air Capture
- + legacy gas CC and a sliver of BECCS
Coal-to-gas switching never selected: retrofit CC to existing coal is cheaper than capital write-off. Industrial electrification is limited to 8.6 TWh of oil-displaced process heat — not yet competitive at our cost assumptions.
+EUR 5.0 Bn/yr
~half of the EUR 10.5 Bn NZ premium goes to CC + DAC + sequestration.
Financial risks — and the cost-of-capital trap
-
CO₂ storage execution risk
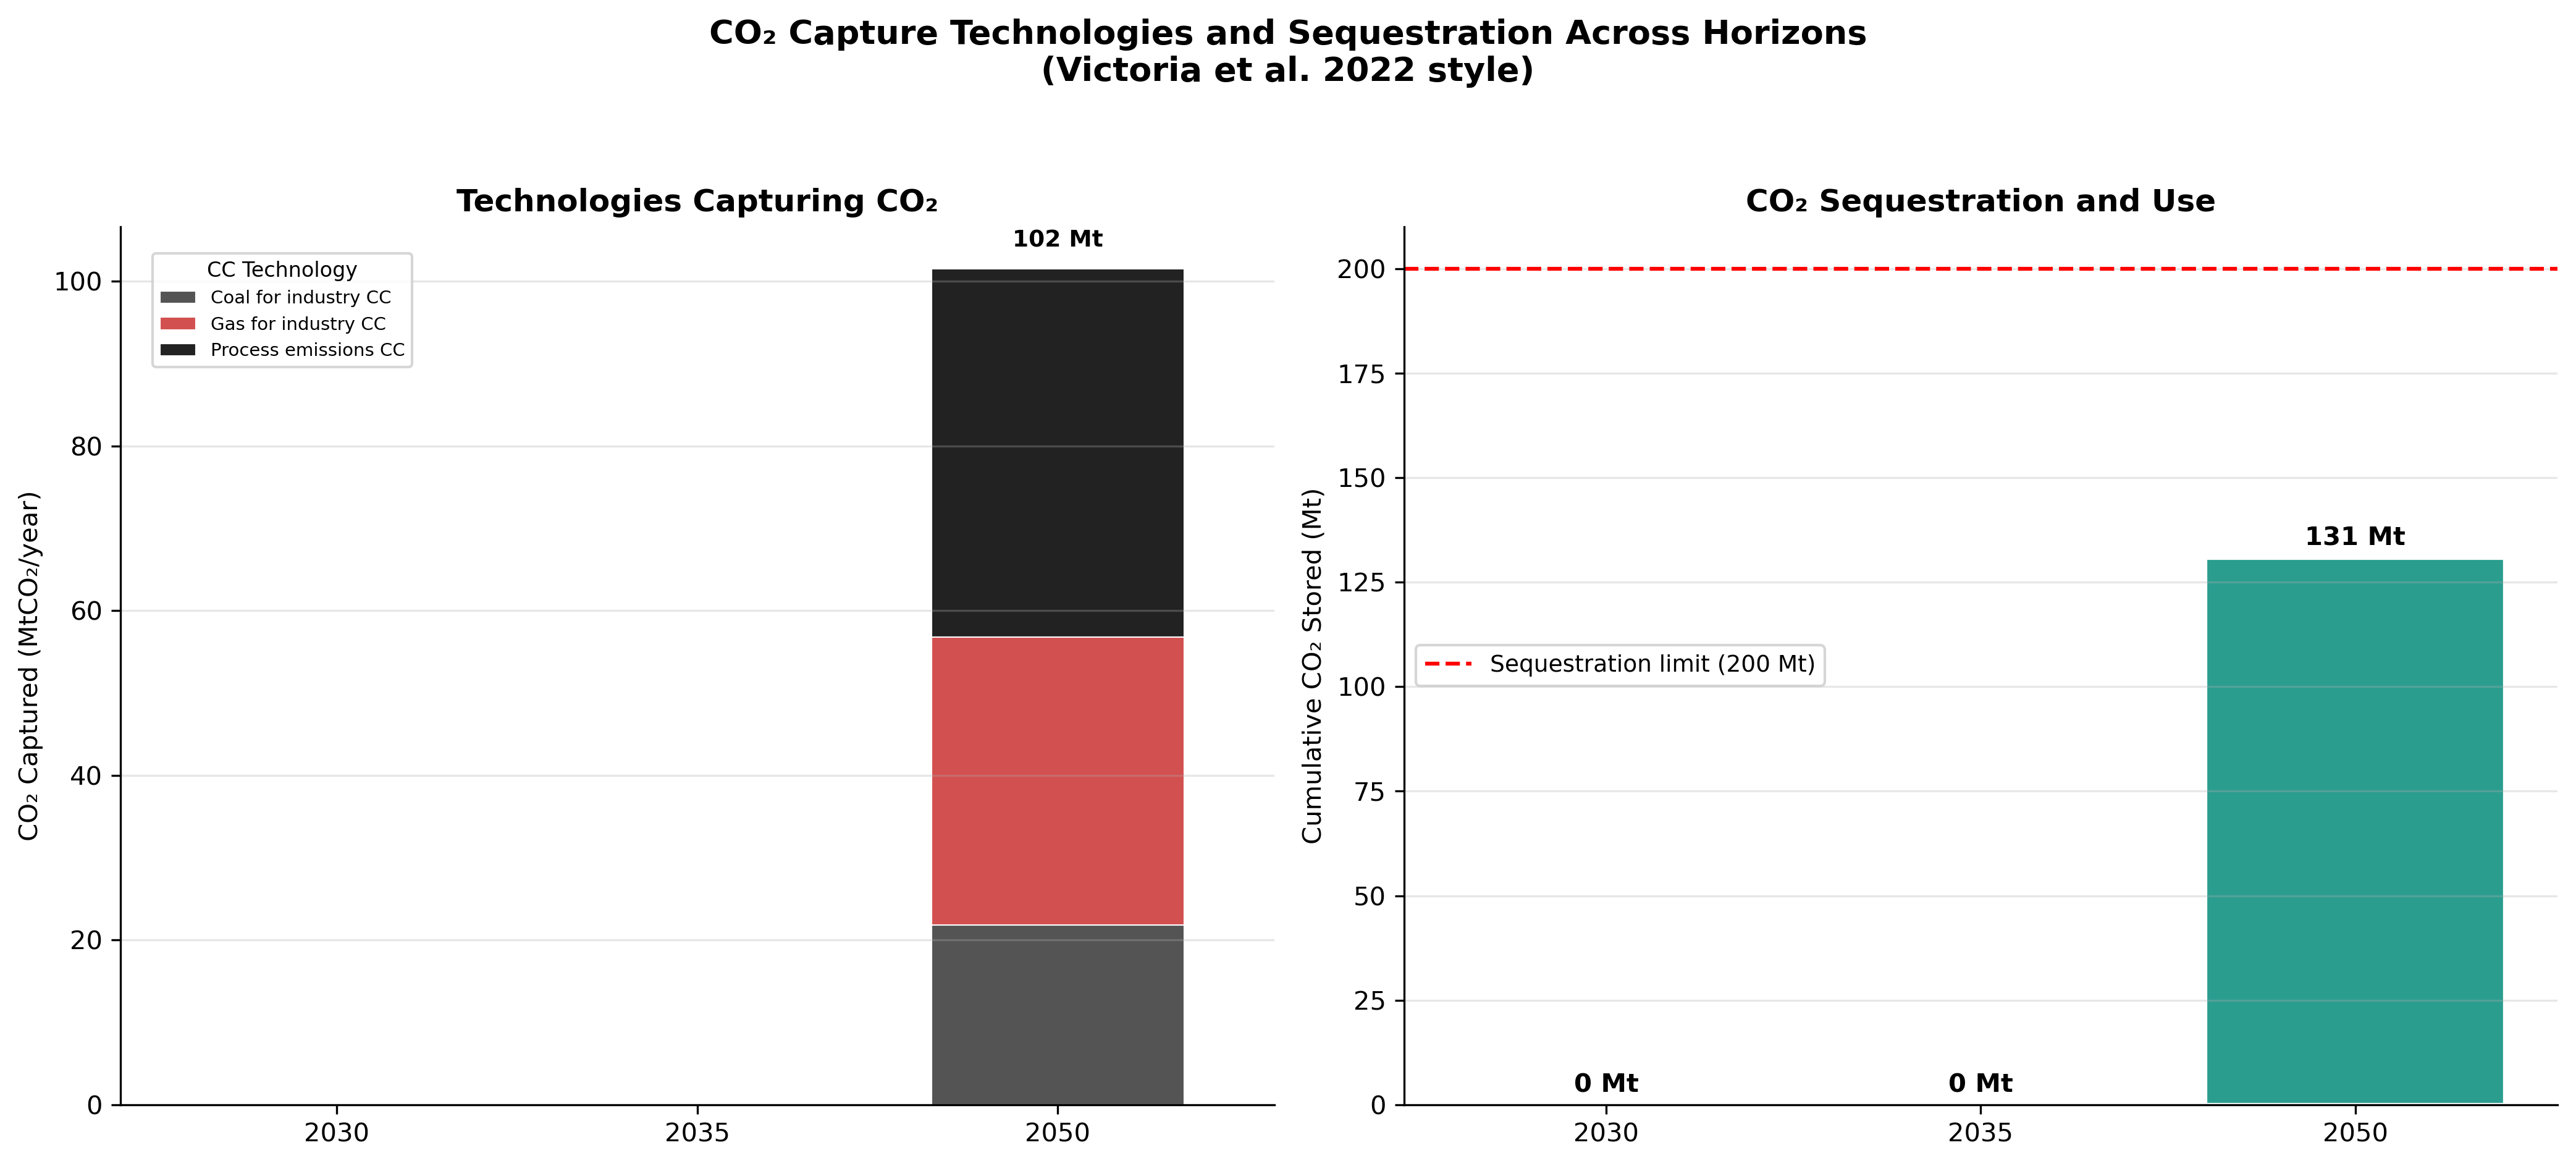
137 Mt cumulative CO₂ stored by 2050 (68% of the 200 Mt potential we assume). Whether Bangladesh actually has Bay-of-Bengal offshore formations at this scale is undemonstrated — and the binding feasibility test of the entire NZ pathway.
-
Cost-of-capital divergence under VRE
As VRE penetration rises, dispatchable backup faces revenue volatility and lenders price it as risk: gas backup 10–14% WACC vs solar/wind 6–7% . CfD-backed projects raise capital at 6.25% vs 12.25% for merchant peers.
-
Bangladesh technology cost premium
Solar 36% more expensive than EU defaults (EUR 523 vs 384/kW), CCGT 42% more expensive (EUR 1,246 vs 878/kW). IEPMP 2023 projects BD costs increasing through 2050 — counter to global learning curves.
-
Stranded fossil + foresight tax
Coal fleet retires entirely by 2050 under NZ. The "foresight tax" (NZ Greenfield − NZ Myopic = +EUR 2.2 Bn/yr, +5.5%) is the cost of not anticipating the 2050 cap when sizing 2030 builds.
Sources: Mays & Jenkins 2023, Hong-Kubik-Shore 2025, Gohdes et al. 2022 (cost of capital); IEPMP 2023, BPDB (BD costs).
Three policy levers, in sequence
Geological surveys of Bay-of-Bengal offshore formations; pilot injection projects; inter-government storage frameworks. Without credible storage, the modelled 137 Mt cumulative pathway is infeasible.
Coal + oil combustion alone (26 Mt) exceeds the 2050 budget. Industrial CC clusters around cement & coal-using industry; pilot electric process heat & green H₂ even where not yet cost-optimal — they hedge the all-CC bet.
Restore BERC independence (Aug 2024 gazette is step one); unbundle BPDB's generation from single-buyer role; competitive procurement. Smart-grid value cannot be unlocked at stage 2–3 of the liberalisation staircase.
Sequence matters. Power-sector RE auctions are easy and politically popular but deliver less than 30% of the cumulative CO₂ work. The three levers above are where the report parts company with the standard "scale-RE-first" playbook.
Energy equity — and the cooking-fuel emergency
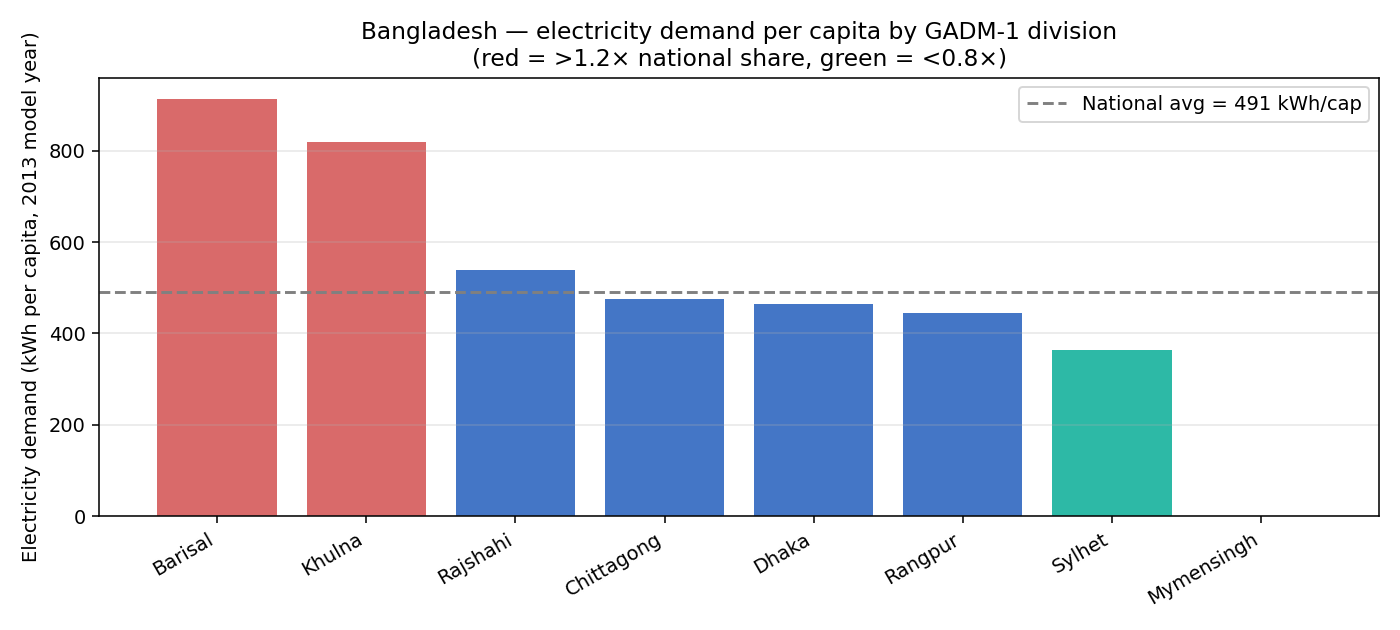
The deeper equity issue is cooking, not metered electricity. ~50% of households still cook on biomass; LPG reaches ~30%, electric induction <5%. NZ leaves 12.9 Mt CO₂/yr of residential heat residual in 2050 — that's the cooking-fuel transition the model is too cautious to force.
Per-capita demand: 914 kWh (Barisal) down to 365 kWh (Sylhet) — a 2.5× gap. NZ generation lands in Rajshahi and Sylhet (currently 2nd-poorest and least-served), so supply-side is mildly redistributive.
NZ wholesale uplift +30–40%; if passed through to the lifeline tariff (Tk 4/kWh) at current cross-subsidy ratios, bottom-quintile energy burden flips into double digits — preserving affordability requires explicit tariff design, not just RE deployment.
Energy security — net-zero is the security win
2,200 vs IN 3,800 / VN 3,200 / US 2,200
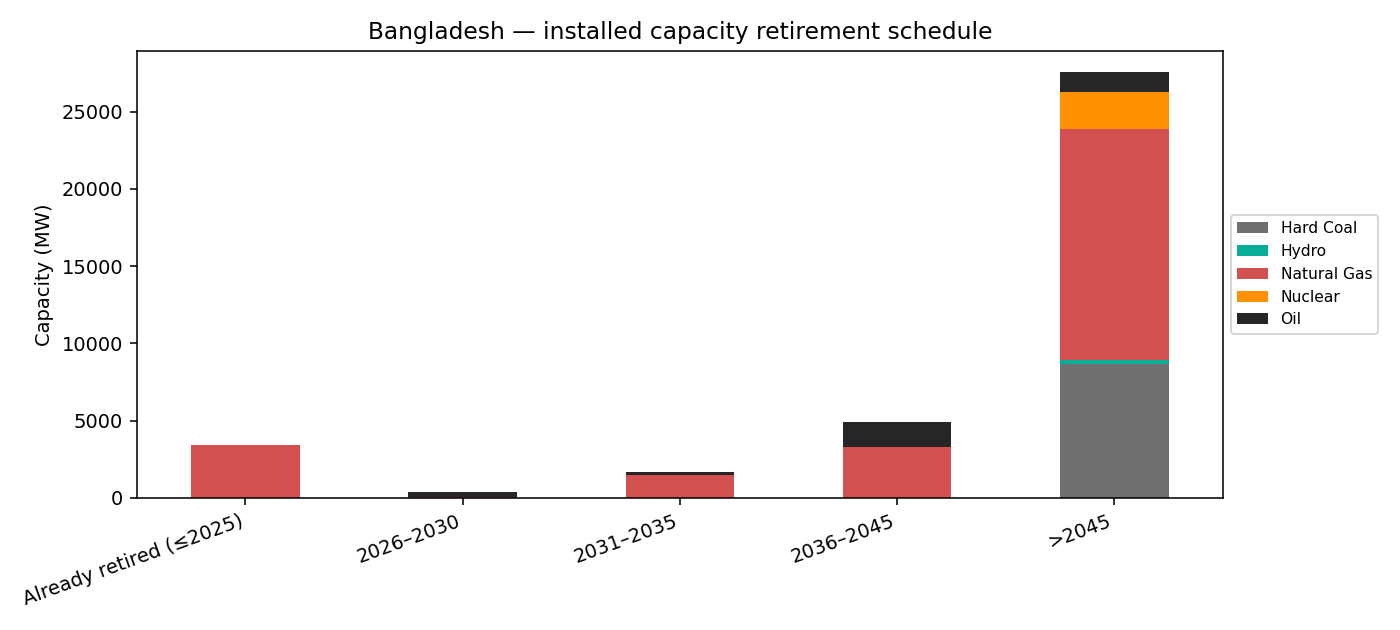
Bangladesh moves from one of Asia's most concentrated fuel mixes to best-in-class. Insulation against the next 2022-style LNG affordability shock — a benefit of equal magnitude to the climate benefit.
But: exposure shifts, not removes — China dominates solar (~95%) and batteries (~80%); Russia supplies Rooppur fuel cycle. Diversification through Korean/French/Chinese nuclear bidding and South Korean LiFePO₄ batteries softens but doesn't eliminate single-supplier concentration.
Stranded-asset cliff post-2045: 8.7 GW coal + 15 GW gas + 1.3 GW oil + 2.4 GW nuclear retire concurrently. Just-transition fund estimate EUR 0.5–1 Bn.
The carbon-storage feasibility test
The pathway models 137 Mt cumulative CO₂ stored by 2050, against an assumed 200 Mt potential. Whether Bangladesh has that storage in the Bay of Bengal is outside our scope — but it is the binding feasibility test of the entire Net-Zero pathway.
Three things to take away
Net-zero is technically feasible. Whether Bangladesh has the geological storage, the institutional reform, and the international finance to make it real is a policy question — not an engineering one.